

Isaac Jonas
Streetwise Economics, Abbotsford, British Columbia, Canada
isacjonasi@gmail.com · www.streetwiseeconomics.com
1 September 2026
Keywords: tariffs; interprovincial trade; British Columbia; softwood lumber; regional labour markets; import substitution
Abstract
Tombe (2026) estimates that the current round of United States tariffs places roughly 87,200 Canadian jobs at risk, about 11,200 of them in British Columbia. A prominent line of argument holds that liberalising interprovincial trade can absorb part of such a shock, and the estimated gains from internal liberalisation are large (Albrecht and Tombe 2016; Alvarez, Krznar and Tombe 2019; Tombe 2025). This paper asks whether that mechanism is available to British Columbia’s most exposed sector. I argue first that the internal trade literature works on the cost of imported inputs, whereas tariff exposure is an export-side problem, and that the two do not compose as commentary often assumes. I then bound the export-side channel directly. Using published volumes for the softwood lumber market, Canadian domestic consumption would have to rise 44.8 per cent to absorb what the British Columbia Interior alone ships to the United States, and 81.1 per cent to absorb all Canadian volume bound for that market. Against observed growth in national housing starts of 5.6 per cent in 2025, and after pro-rating British Columbia’s claim on the incremental domestic market against the Quebec, Ontario and Alberta producers displaced alongside it, the feasible absorptive elasticity is about 0.07. Two further results support the case for a regional rather than provincial frame: the province’s headline effective tariff increase of about 7 per cent conceals a stacked rate of 35 to 45 per cent on softwood lumber, and exposure per thousand workers in four northern and interior regions runs four to six times the provincial average. The Bank of Canada (2026) reports lumber exports about 20 per cent below 2024 averages by February 2026 and finds diversification constrained by transport costs, which is consistent with the bound derived here.
1. Introduction
The most widely cited estimate of the employment consequences of the current United States tariff round is Tombe (2026). Matching Canadian export lines to the list of goods subject to the tariffs, and assuming affected sales fall in proportion to the tariff rate, he puts roughly 87,200 jobs at risk nationally: about 52,000 direct and a further 35,000 in supplying and servicing industries. Ontario carries some 36,100 of these, Quebec 18,300, British Columbia 11,200 and Alberta 9,000. British Columbia’s effective tariff increase, at roughly 7 per cent, is the highest among the four largest provincial economies.
I take that estimate as given. Nothing here revises it, and I have no independent line-matching exercise to offer. What I do have is two questions a national exercise is not built to answer.
The first is about adjustment. Since early 2025 a great deal of Canadian commentary has held that removing interprovincial trade barriers offers a partial shield against foreign protectionism. The underlying research is serious and the estimated gains are large. Whether the mechanism reaches British Columbia’s most exposed sector is a separate question, and it turns on the size of the domestic market rather than on the height of regulatory barriers. It can be answered with published volumes.
The second is about geography. Eleven thousand jobs spread across a labour force of 2.9 million is a small number. The same total concentrated in four resource-dependent regions is not, and it implies a different policy response. Provincial averages hide this. So does a provincial average tariff rate.
Section 2 sets out what the internal trade literature actually claims. Section 3 distinguishes two substitution mechanisms that are often run together. Section 4 covers data. Section 5 derives the capacity bound, Section 6 examines duty stacking, and Section 7 maps exposure across the seven economic regions. Section 8 asks whether the eighteen months since the tariffs took effect are consistent with the bound. Sections 9 and 10 discuss implications and limits.
2. What the internal trade literature highlights
The case for internal liberalisation is well established and quantitatively serious. Albrecht and Tombe (2016) model interprovincial trade costs in a multi-sector framework with input linkages and find substantial productivity gains from lowering them. Alvarez, Krznar and Tombe (2019) put the potential gain from liberalising internal trade in goods at several per cent of GDP. Tombe (2025) works the estimates through province by province and finds that a 10 per cent reduction in a province’s internal import barriers yields real GDP gains ranging from about 1.9 per cent in Ontario to more than 6 per cent in Prince Edward Island, with a national elasticity near 0.3.
That last paper is explicit that the tariff environment is part of the motivation. It notes the urgency of provincial action “given Canada’s current economic challenges, including declining real GDP per capita and the looming threat of a 25 per cent tariff on Canadian exports to the US” (Tombe 2025). I have no quarrel with any of it.
But when I read this perspective in a broader sense, the lever in Tombe (2025) is a reduction in the cost of a province’s internal imports. The gain accrues because firms and households obtain inputs and goods more cheaply from other provinces, which raises measured productivity and real income. That is a statement about the buying side of a provincial economy.
Tariff exposure, as Tombe (2026) measures it, is a statement about the selling side. The jobs at risk are jobs supported by sales to American buyers. Cheaper inputs from Alberta do not restore a customer in Washington State.
I do not think this is a disagreement with the literature. It is a point about composition. Two results, both correct, are being added together in public discussion in a way that neither paper claims. The remainder of this paper tries to quantify what the export-side channel can actually deliver for one province and one sector.
3. Two substitution mechanisms
Here I start by stating the two channels separately.
- Input substitution operates on cost. A Canadian firm buying an American intermediate input faces a higher landed price once counter-tariffs apply. If it can source that input from another province, its cost shock is smaller. Regulatory harmonisation, procurement reform, mutual recognition and trucking rules all act here, and the Canadian Free Trade Agreement is largely addressed to this margin (Tombe and Manucha 2022, 2024).
- Market substitution operates on demand. A firm selling into the United States faces a lower net price once American tariffs apply. Its adjustment margin is not where it buys but where it sells. It needs an alternative buyer, not an alternative supplier.
For the 11,200 British Columbia jobs in question, the binding channel is the second one. A sawmill in Quesnel does not have an input problem. It has a customer problem. Internal trade reform can lower what that mill pays for equipment and freight, which is worth having, but it does not conjure demand for the lumber.
So the question becomes: how much demand is there, domestically, to absorb the demand that was coming from the US?
4. Data
Every input is a published figure. Nothing is calibrated to produce a result, and where a quantity cannot be observed I report a range rather than pick a number.
Employment exposure comes from Tombe (2026). Softwood lumber production and export volumes for 2024 are from Statistics Canada (2025). Duty rates are from Global Affairs Canada (2026). British Columbia merchandise trade values for 2024 are from BC Stats (2025). Employment by industry for the seven British Columbia economic regions, 2024 reference year, is from WorkBC (2025). Forest sector aggregates are from the Council of Forest Industries (2023). Housing starts are from CMHC (2026). Post-tariff trade outcomes in Section 8 are from Bank of Canada (2026).
5. A capacity bound on domestic absorption
5.1 Market structure
Canada produced 47.9 million cubic metres of softwood lumber in 2024 and exported 27.9 million, more than 58 per cent of it to the United States (Statistics Canada 2025). Apparent domestic disappearance is therefore about 20.0 million cubic metres. The British Columbia Interior produced 14.0 million cubic metres and shipped 8.9 million to the United States.
| Quantity, 2024 | Thousand m³ |
|---|---|
| Canadian softwood lumber production | 47,895 |
| Canadian softwood lumber exports, all destinations | 27,927 |
| Apparent Canadian domestic disappearance | 19,968 |
| Canadian softwood lumber exports to the United States | 16,198 |
| B.C. Interior softwood lumber exports to the United States | 8,944 |
Table 1. Canadian softwood lumber market structure, 2024. Production and export volumes from Statistics Canada (2025). Domestic disappearance and United States-bound volume are the author’s calculations, the latter at the 58 per cent lower bound.
5.2 How I read the source, and where it is ambiguous
One number in the Statistics Canada release does not reconcile, and since the whole of Section 5 rests on that release I should say how I have handled it rather than bury it.
The release describes the British Columbia Interior’s 8.944 million cubic metres as approximately 32 per cent of Canada’s total softwood lumber exports to the United States. That reading is not available arithmetically. If 8.944 million is 32 per cent of United States-bound volume, then United States-bound volume is 27.95 million cubic metres, which exceeds the 27.927 million Canada exported to all destinations. Against total exports the figure reconciles almost exactly, at 32.03 per cent.
I have therefore read the 32 per cent as a share of total exports. I may be wrong, but that is the number I use in this analysis.
It matters less than it might appear. The choice affects only how much of Canada’s displaced volume is British Columbia’s, not the size of the domestic market. If the United States share of softwood exports is 86 per cent rather than 58, which is the share Statistics Canada reports for wood products as a whole, British Columbia’s share of displaced volume falls from 55.2 to 37.2 per cent and the feasible elasticity in Table 2 falls from 0.069 to 0.046. The headline figure in Section 5.3 does not depend on the share at all.
5.3 The expansion the domestic market would have to deliver
The arithmetic is simple. To absorb the volume the British Columbia Interior currently ships to the United States, Canadian domestic consumption would have to rise by 8.9 against a base of 20.0 million cubic metres. That is 44.8 per cent. To absorb all Canadian volume bound for the United States, 81.1 per cent.
Neither number resembles anything the Canadian market has produced. Housing starts, which drive domestic lumber demand, reached 259,028 units in 2025 against 245,367 in 2024, a rise of 5.6 per cent and among the strongest annual totals on record (CMHC 2026). British Columbia starts fell 5 per cent over the same period. A 44.8 per cent expansion in domestic lumber consumption is not a target internal trade reform can reach. It is a different housing market.

Fig. 1. Required expansion in Canadian domestic softwood lumber consumption, against observed growth in national housing starts in 2025. Sources: Statistics Canada (2025); CMHC (2026).
5.4 British Columbia does not have the domestic market to itself
There is a second constraint, and it is easy to miss. British Columbia is not the only province displaced. Quebec, Ontario and Alberta producers lose access to the same market at the same moment. They are competitors for the incremental domestic demand, not buyers of British Columbia’s output. On the analysis in Section 5.2, the British Columbia Interior accounts for 55.2 per cent of Canada’s displaced United States-bound volume, and can claim that share of whatever additional domestic demand appears.
5.5 The implied absorptive elasticity
In addition, putting the two constraints together and a feasible value falls out for the absorptive elasticity, γ, defined as the proportion of British Columbia’s displaced volume that domestic substitution can take up. At the observed 2025 rate of domestic demand growth, γ is about 0.07. Even at a 20 per cent expansion in domestic lumber consumption, which has no modern precedent, it reaches only 0.25.
| Growth in domestic consumption | Incremental absorption (000 m³) | B.C. pro-rata share (000 m³) | Implied γ |
|---|---|---|---|
| 2.5% | 499 | 276 | 0.03 |
| 5.0% | 998 | 551 | 0.06 |
| 5.6% (observed, 2025) | 1,112 | 614 | 0.07 |
| 10.0% | 1,997 | 1,103 | 0.12 |
| 15.0% | 2,995 | 1,654 | 0.18 |
| 20.0% | 3,994 | 2,205 | 0.25 |
Table 2. Feasible absorptive elasticity for British Columbia wood products under alternative rates of domestic demand growth. Author’s calculation from Statistics Canada (2025) and CMHC (2026).

Fig. 2. Feasible absorptive elasticity against an assumed value of 0.70.
In my earlier draft I started working on this analysis, I used an absorptive elasticity around 0.70. On these figures that is roughly ten times what the domestic market can support for British Columbia wood products. Applied to the province’s 11,200 exposed jobs, a γ of 0.70 with 40 per cent substitution implies about 3,100 jobs shielded. The capacity bound implies fewer than 800. That ceiling does not rise with the substitution rate, because it is set by the size of the market and not by anyone’s willingness to switch.
6. What the provincial average conceals
British Columbia’s effective tariff increase of roughly 7 per cent (Tombe 2026) is an average across a varied export basket. It is not the rate facing the province’s largest single export line. Softwood lumber accounted for $3.3 billion of British Columbia’s $28.7 billion in goods exports to the United States in 2024, or 11.7 per cent (BC Stats 2025), and it already carried duties before this round began.
Antidumping and countervailing duties on Canadian softwood lumber stood at 35.19 per cent for non-selected respondents after the sixth administrative review, effective 29 July 2025. The post-preliminary results of the seventh review, issued 30 June 2026, put the rate at 25.18 per cent, with final results expected in October 2026. A Section 232 global tariff of 10 per cent on timber and softwood lumber applies from 31 December 2025 on top (Global Affairs Canada 2026). The rates stack.
| Product line | Combined rate | Multiple of provincial average |
|---|---|---|
| All B.C. exports (provincial average increase) | 7.0% | 1.0× |
| Softwood lumber, 2025 duty basis | 45.2% | 6.5× |
| Softwood lumber, 2026 preliminary duty basis | 35.2% | 5.0× |
| Kitchen cabinets and vanities, 2026 | 25.0% | 3.6× |
| Kitchen cabinets and vanities, from 1 Jan 2027 | 50.0% | 7.1× |
| Upholstered furniture, from 1 Jan 2027 | 30.0% | 4.3× |
Table 3. Effective ad valorem rates on selected British Columbia wood product lines against the provincial average effective tariff increase. Sources: Global Affairs Canada (2026); Tombe (2026).

Fig. 3. Duty stacking on softwood lumber against the provincial average. The pre-existing antidumping and countervailing duties are the larger component.
Two things follow. A provincial average understates the shock to the lines carrying most of British Columbia’s wood employment by a factor of five to seven. And the exposure is still rising: kitchen cabinets and vanities move from 25 to 50 per cent on 1 January 2027, upholstered furniture from 25 to 30. Whatever the seventh review finalises in October, the Section 232 schedule steps up after it.
7. Where the exposed jobs are
7.1 Method
I cannot observe wood product manufacturing employment by the British Columbia economic region, because to my knowledge Statistics Canada does not publish it at that level. Hence,R rather than applying a split and presenting a single figure, I use two allocation bases and report the range. Basis A distributes the 11,200 exposed jobs in proportion to regional forestry, logging and support activity employment. It captures the woods side and understates mill towns. Basis B uses forestry, logging and support plus all manufacturing. It captures mills but credits Mainland/Southwest with manufacturing that has no wood in it. I prefer neither. The finding is the range, and the ranking is stable across both.
7.2 Results
British Columbia averages 3.8 exposed jobs per thousand workers. Four regions sit well above that on both bases. North Coast and Nechako carries between 5.1 and 22.1, Cariboo between 7.4 and 18.1, Northeast between 2.6 and 16.5, Kootenay between 5.1 and 14.6. Mainland/Southwest, holding 64.9 per cent of the provincial workforce, carries between 1.0 and 3.7.
| Economic region | Employment | Share of B.C. | Exposed jobs | Per 1,000 workers |
|---|---|---|---|---|
| North Coast and Nechako | 45,747 | 1.6% | 235–1,011 | 5.1–22.1 |
| Cariboo | 83,613 | 2.9% | 616–1,516 | 7.4–18.1 |
| Northeast | 35,456 | 1.2% | 91–585 | 2.6–16.5 |
| Kootenay | 86,580 | 3.0% | 440–1,264 | 5.1–14.6 |
| Vancouver Island/Coast | 469,493 | 16.1% | 1,366–3,175 | 2.9–6.8 |
| Thompson-Okanagan | 302,287 | 10.4% | 1,420–1,801 | 4.7–6.0 |
| Mainland/Southwest | 1,891,375 | 64.9% | 1,848–7,032 | 1.0–3.7 |
Table 4. Regional distribution of British Columbia’s tariff-exposed employment, ranges across two allocation bases. Employment from WorkBC (2025); exposure total from Tombe (2026); allocation by the author.
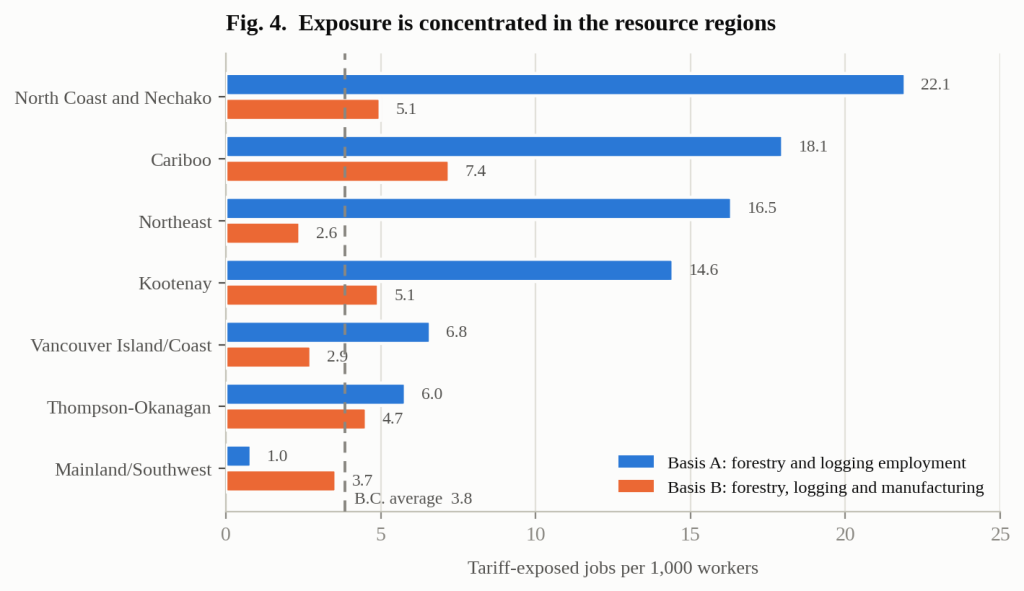
Fig. 4. Tariff-exposed jobs per thousand workers by British Columbia economic region under both allocation bases, against the provincial average of 3.8.
The pattern is the finding. Exposure per worker in the four northern and interior regions runs four to six times the provincial average on the narrower basis and stays above it on the broader one. These are also the regions with the fewest alternative employers. The Council of Forest Industries (2023) reports that the forest sector supports one in every 28 jobs in British Columbia and one in six manufacturing jobs, and that only a quarter of forest industry employment sits in the Lower Mainland. The other three quarters sit where Table 4 points.
A displaced worker in Mainland/Southwest re-enters a labour market of 1.9 million positions. A displaced worker in North Coast and Nechako re-enters one of 45,747, where the largest goods-producing employer is the industry that just contracted. A provincial aggregate treats those two workers as the same. They are not.
8. Is any of this visible yet?
A capacity bound is a statement about what cannot happen. It is worth asking whether the period since the tariffs took effect looks consistent with it.
The Bank of Canada (2026) assessed the first year of United States trade restrictions across Canadian industries. Lumber exports were running roughly 20 per cent below 2024 averages by February 2026. On diversification, the assessment is direct: moving trade away from the United States “would be difficult due to barriers such as high transportation costs to more distant markets.” Where reorientation did occur it came at a price. Aluminium producers redirected sales to Europe, the Bank notes, “but at lower profit margins.” Copper producers shifted into product lines that were not tariffed rather than into new markets.
None of that is a test of the elasticity derived here, and I do not present it as one. Eighteen months is short, and firms adjust on many margins at once. But if a large share of displaced lumber volume were being absorbed domestically or diverted offshore, lumber exports twenty per cent below their prior average is not the pattern I would expect to see, and a central bank citing transport costs as the binding constraint on diversification is not the language I would expect it to use.
9. Implications
Three implications follow. I offer them as a contribution to the discussion, not as settled conclusions.
Internal trade reform should not be presented as a substitute for adjustment support in British Columbia’s wood-exposed regions. The domestic market is roughly a fifth of the size full absorption would require, and the province competes with other displaced producers for whatever increment appears. This says nothing against internal trade reform, which rests on its own evidence and delivers its gains through the input channel described in Section 3. It says that the two should not be added together.
British Columbia’s realistic market substitution margin runs west rather than east. The province already ships solid wood and pulp to Japan, China and Korea through Vancouver and Prince Rupert. Whether that margin can be widened, and at what cost in grade, freight and certification, strikes me as the more productive question, and the Bank of Canada’s transport-cost finding suggests it will not be easy. I have not sized it, and it is the natural next paper rather than something I can assert here.
The geographic concentration argues for place-based instruments. An 11,200-job provincial exposure is manageable in aggregate and severe in four regions. Adjustment funding, retraining capacity and diversification support allocated per capita across the province would systematically underserve the places carrying the shock.
10. Limitations
The capacity bound is calculated for softwood lumber. That is British Columbia’s largest exposed line but not its only one. Tombe (2026) identifies printed circuit board and related electronics exports as a second significant source of provincial exposure, and the absorption arithmetic here does not extend to that sector, whose domestic market structure is different and which is not concentrated in the resource regions. The regional allocation in Section 7 therefore overstates the northern and interior share and understates Mainland/Southwest.
Apparent domestic disappearance omits imports and stock change, which pushes the required expansion up rather than down. I have bounded that in footnote 2 rather than resolved it.
The elasticity treats the incremental domestic market as the only absorption channel. It excludes third-country diversion, which Section 9 names as the more promising margin and which this paper does not size.
The regional allocation is proportional, not behavioural. It distributes a provincial total on an employment basis. It does not model differential closure risk, mill-level economics, or the effect of company-specific duty rates, and a critic would be within their rights to call Basis A an upper bound on resource-region concentration rather than an estimate. A mill-level analysis would be a real improvement and needs data that is not public.
Finally, the duty environment is moving. The seventh administrative review was at post-preliminary stage when I wrote this, with final results expected in October 2026, and the Section 232 schedule steps up on 1 January 2027. Read the figures against those dates.
11. Conclusion
Taking Tombe (2026) as given, the domestic Canadian market cannot absorb more than a small fraction of the softwood lumber volume British Columbia ships to the United States. Full absorption of the British Columbia Interior’s volume alone would require Canadian domestic consumption to rise 44.8 per cent. At observed rates of domestic demand growth, and after accounting for the other provinces displaced into the same market, the feasible absorptive elasticity is about 0.07 rather than the values near 0.70 that circulate informally.
The province’s headline effective tariff increase of about 7 per cent also conceals stacked rates of 35 to 45 per cent on softwood lumber, and exposure per thousand workers in four northern and interior regions runs four to six times the provincial average.
Interprovincial substitution is a weak instrument against this particular shock. That is not an argument against internal trade liberalisation, whose gains are well evidenced and arrive through a different channel. There is an argument that the channels should be kept apart in policy discussion, and that British Columbia’s adjustment policy should be built for the regions actually carrying the exposure.
Acknowledgements
This paper builds directly on Trevor Tombe’s published estimates and would not exist without them. Any errors in extending that work to the regional level are mine alone.
References
- Albrecht, L. and T. Tombe (2016). “Internal trade, productivity and interconnected industries: A quantitative analysis.” Canadian Journal of Economics 49(1): 237–263. https://onlinelibrary.wiley.com/doi/abs/10.1111/caje.12196
- Alvarez, J., I. Krznar and T. Tombe (2019). “Internal Trade in Canada: Case for Liberalization.” IMF Working Paper WP/19/158. International Monetary Fund, Washington DC. https://www.imf.org/en/Publications/WP/Issues/2019/07/22/Internal-Trade-in-Canada-Case-for-Liberalization-47100 (accessed 1 September 2026).
- Bank of Canada (2026). “One year later: Assessing the impact of US trade restrictions on Canadian industries.” Monetary Policy Report, In Focus, 29 April 2026. https://www.bankofcanada.ca/publications/mpr/mpr-2026-04-29/in-focus-2/ (accessed 1 September 2026).
- BC Stats (2025). “British Columbia and U.S. Tariffs.” Province of British Columbia, 26 March 2025 (2024 trade year). https://www2.gov.bc.ca/gov/content/data/statistics/economy/trade/trade-data (accessed 1 September 2026).
- CMHC (2026). “Housing starts up 5.6% in 2025 from 2024.” Canada Mortgage and Housing Corporation, news release, December 2025 data. https://www.cmhc-schl.gc.ca/media-newsroom/news-releases/2026/housing-starts-december-2025 (accessed 1 September 2026).
- Council of Forest Industries (2023). The Economic Impact of British Columbia’s Forest Sector. COFI, Vancouver (2022 reference year). https://cofi.org/new-cofi-economic-impact-study-affirms-forest-industry-vital-to-provincial-economy/ (accessed 1 September 2026).
- Global Affairs Canada (2026). “Softwood lumber: recent developments.” Seventh administrative review, post-preliminary results, 30 June 2026; sixth administrative review, final results effective 29 July 2025. https://www.international.gc.ca/controls-controles/softwood-bois_oeuvre/recent.aspx?lang=eng (accessed 1 September 2026).
- Statistics Canada (2025). “A look at Canada’s lumber industry in 2024.” Catalogue no. 11-627-M, release 11-627-M2025061. Ottawa. https://www150.statcan.gc.ca/n1/pub/11-627-m/11-627-m2025061-eng.htm (accessed 1 September 2026).
- Tombe, T. (2025). Breaking Barriers: How provinces can drive Canada’s prosperity by unlocking trade and labour mobility. Macdonald-Laurier Institute, February 2025. https://macdonaldlaurier.ca/wp-content/uploads/2025/02/20250220_Internal-trade-barriers-Tombe-PAPER-NEW-FINAL.pdf (accessed 1 September 2026).
- Tombe, T. (2026). “What’s at stake in the Canada-U.S. trade deal: how looming tariffs could cost Canada 90,000 jobs.” Macdonald-Laurier Institute / The Hub, 20 August 2026. https://macdonaldlaurier.ca/whats-at-stake-in-the-canada-u-s-trade-deal-how-looming-tariffs-could-cost-canada-90000-jobs/ (accessed 1 September 2026).
- Tombe, T. and R. Manucha (2022). Liberalizing Internal Trade Through Mutual Recognition: A Legal and Economic Analysis. Macdonald-Laurier Institute.
- Tombe, T. and R. Manucha (2024). Roadblocks Ahead: Internal Barriers to Trade in Canada’s Truck Transportation Sector. Macdonald-Laurier Institute.
- WorkBC (2025). “B.C. and Regional Profiles.” Province of British Columbia, 2024 employment reference year; profiles for Cariboo, Kootenay, Mainland/Southwest, North Coast and Nechako, Northeast, Thompson-Okanagan and Vancouver Island/Coast. https://www.workbc.ca/research-labour-market/bc-and-regional-profiles (accessed 1 September 2026).
Leave A Comment